Hail Alley and your RV roof: Kansas logs 77 big-hail reports per 10,000 square miles a year, California under 1
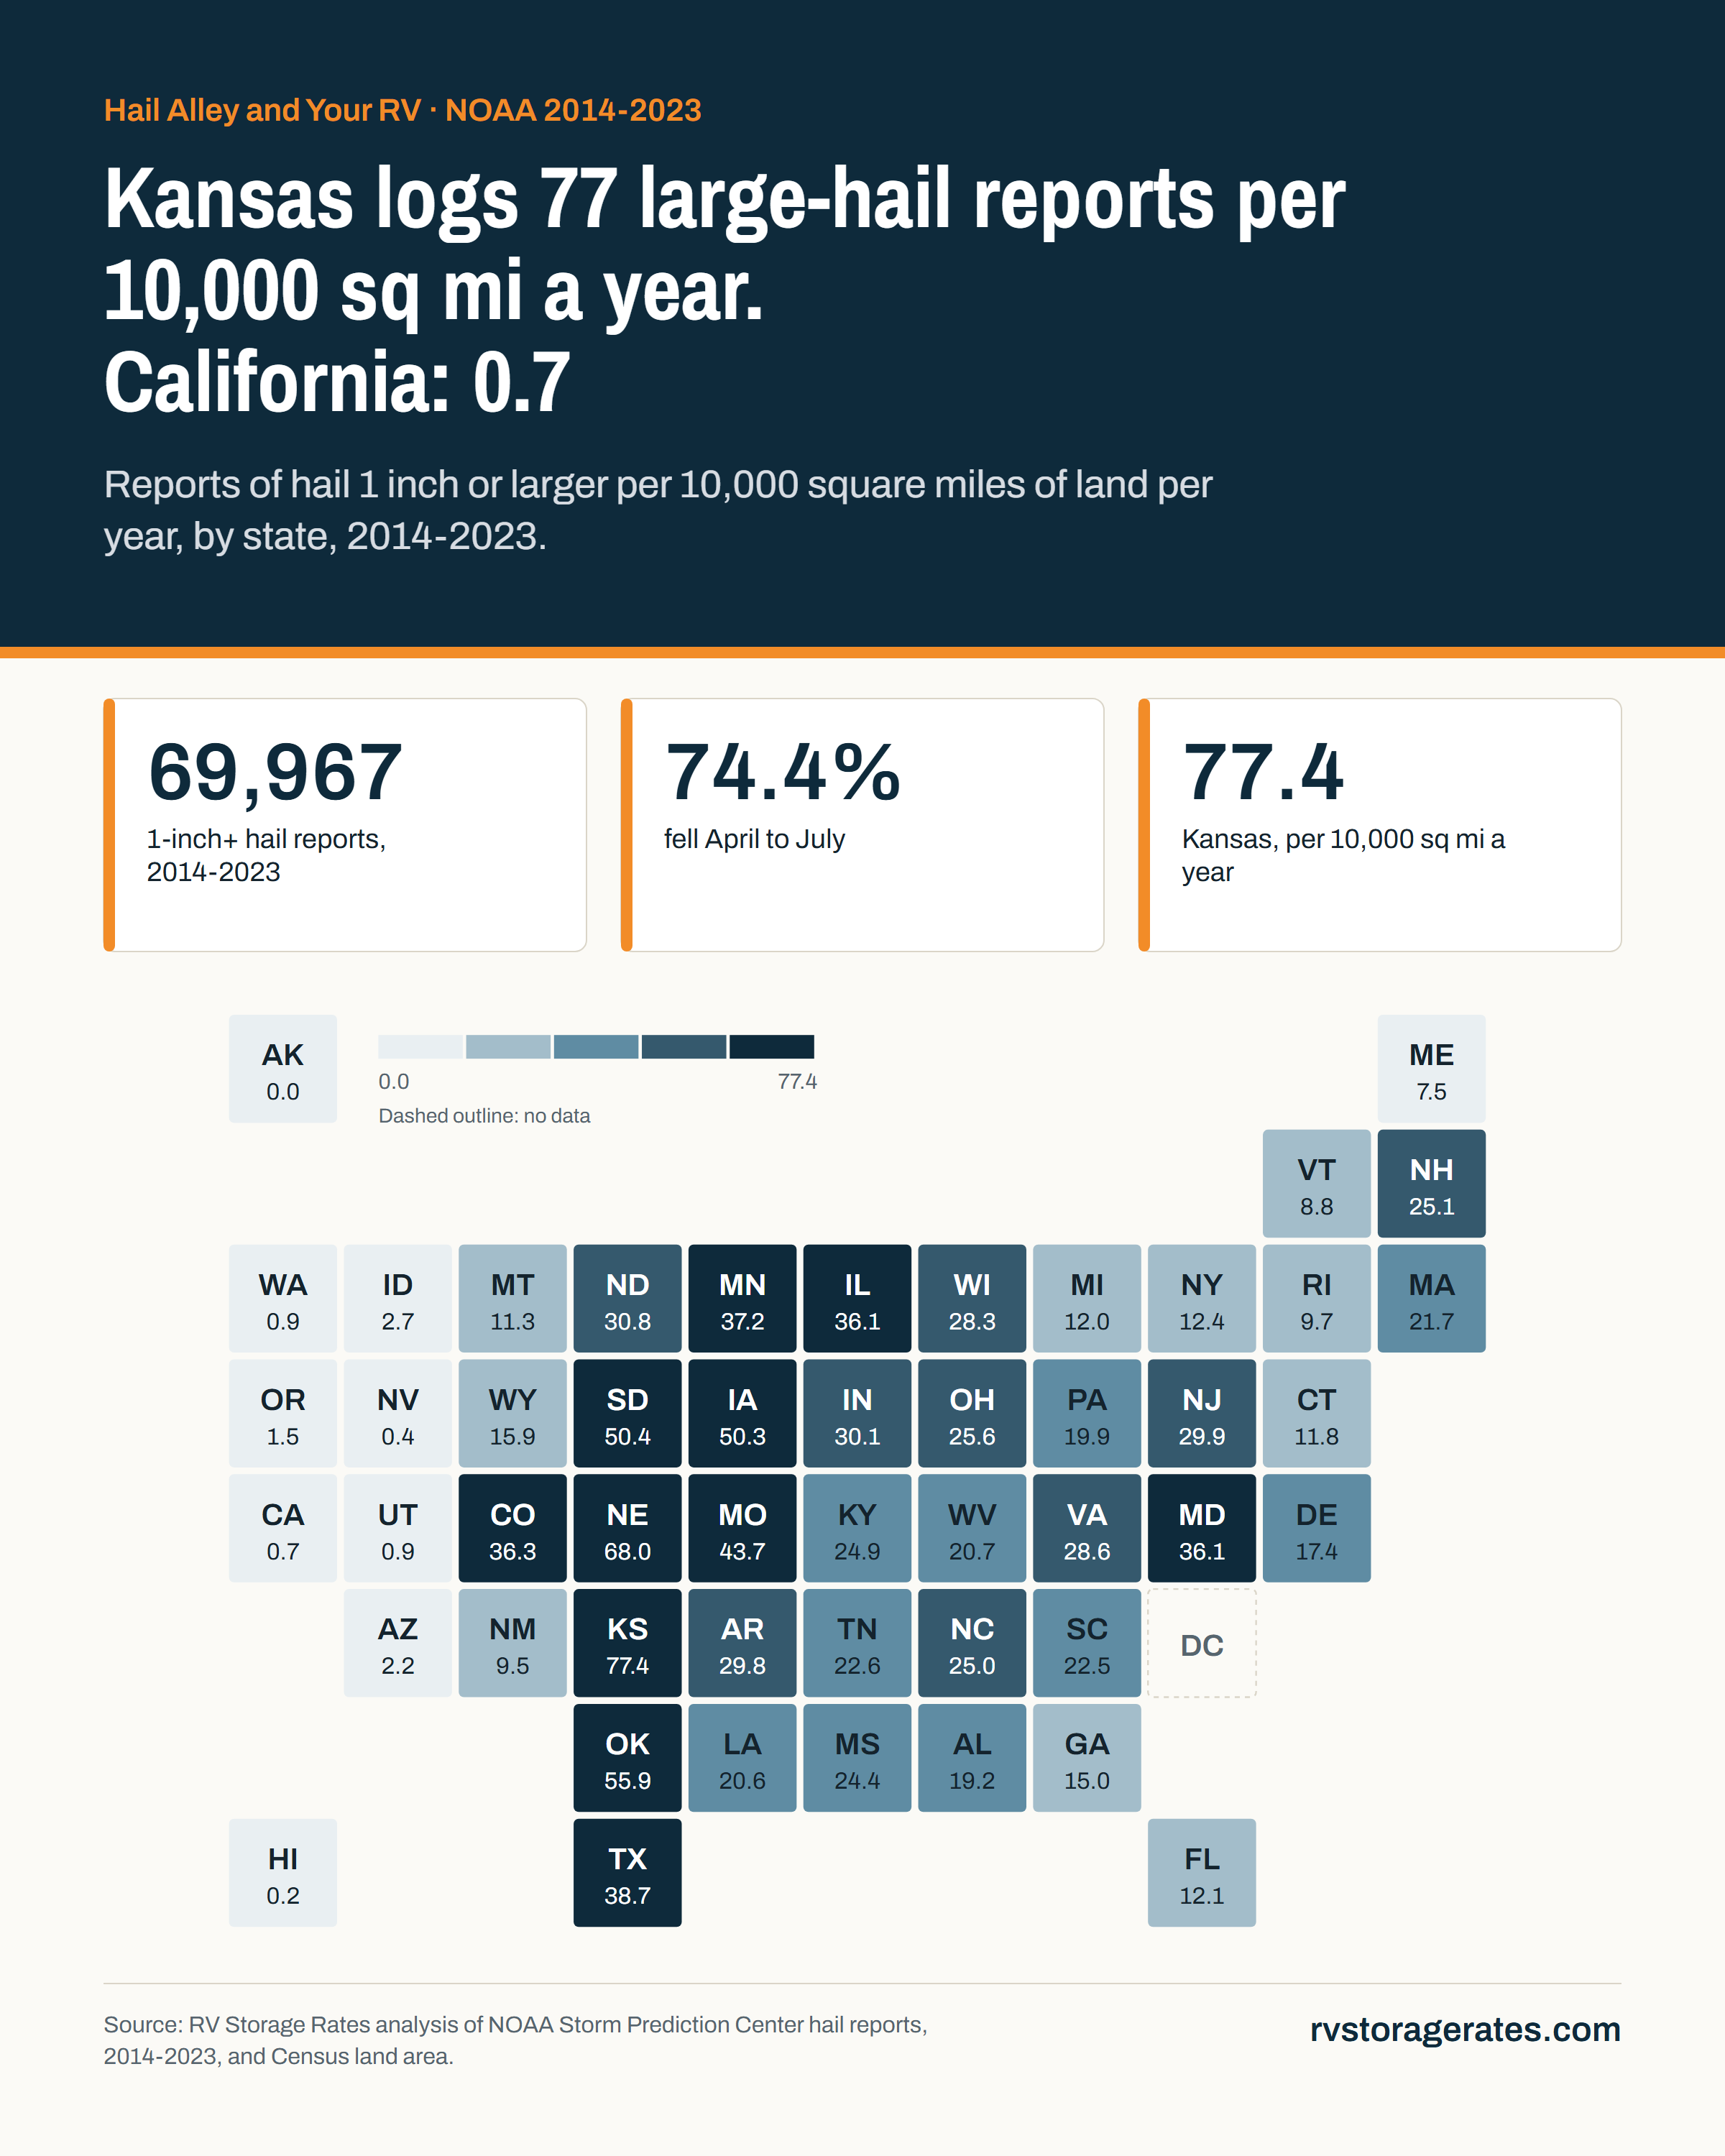
We counted the 69,967 reports of hail one inch or larger in NOAA's Storm Prediction Center database for 2014 to 2023 and divided by each state's land area. Kansas leads with 77.4 reports per 10,000 square miles a year, followed by Nebraska (68.0) and Oklahoma (55.9). 74.4% of all reports came between April and July. We set that against how often storage facilities in each state mention covered or indoor spaces.
By the RV Storage Rates research desk · Published October 25, 2026
Key findings
- Kansas has the densest large hail: 77.4 reports of 1-inch-plus hail per 10,000 square miles per year, ahead of Nebraska (68.0), Oklahoma (55.9), South Dakota (50.4) and Iowa (50.3).
- Texas has the most reports by far: 10,124 of 1-inch-plus hail and 1,693 of 2-inch-plus hail in ten years, 38.7 per 10,000 square miles a year.
- Hail season is April to July. 74.4% of reports fall in those four months, and May alone accounts for 23.0%.
- The West Coast and Great Basin barely see it: California 0.7, Washington and Utah 0.9, Nevada 0.4 per 10,000 square miles a year.
- Covered storage is scarce in parts of the hail belt. Under 10% of facilities in Nebraska (9.7%), Iowa (8.3%) and South Dakota (7.8%) mention covered spaces, against 30.2% in Texas.
Where large hail falls
Hail of one inch, about the size of a quarter, is the size the National Weather Service treats as severe. It is also large enough to crack a fibreglass cap, pit aluminium siding, split roof vents and skylights, and puncture an aged rubber roof. We mapped how often hail that size was reported per 10,000 square miles of land each year.
The classic Hail Alley runs from Texas and Oklahoma north through Kansas, Nebraska and the Dakotas, with Iowa, Missouri and Minnesota close behind. Colorado's Front Range (36.3) is in the same league as Illinois and Maryland (36.1 each). East of the Mississippi the rate is lower but far from zero: Indiana, New Jersey, Arkansas and North Dakota all sit near 30. West of the Rockies, large hail is rare.
When it falls
Large hail is a spring and early summer hazard. Reports climb from 4,923 in March to 16,125 in May, stay high through June (14,965) and July (10,088), and fade by October. That is also when most RVs come out of storage, so a rig parked on an open lot or in a driveway between trips is exposed at exactly the wrong time.
Hail risk and covered storage, state by state
| Kansas | 6,325 | 789 | 77.4 | 22% | 34% |
| Nebraska | 5,225 | 677 | 68.0 | 9.7% | 35% |
| Oklahoma | 3,837 | 566 | 55.9 | 22% | 33% |
| South Dakota | 3,819 | 437 | 50.4 | 7.8% | 31% |
| Iowa | 2,807 | 294 | 50.3 | 8.3% | 26% |
| Missouri | 3,003 | 252 | 43.7 | 19% | 32% |
| Texas | 10,124 | 1,693 | 38.7 | 30% | 31% |
| Minnesota | 2,961 | 332 | 37.2 | 17% | 44% |
| Colorado | 3,763 | 523 | 36.3 | 16% | 30% |
| Illinois | 2,005 | 168 | 36.1 | 18% | 43% |
| Maryland | 351 | 19 | 36.1 | 22% | 34% |
| North Dakota | 2,128 | 216 | 30.8 | 5.6% | 49% |
| Indiana | 1,078 | 82 | 30.1 | 16% | 34% |
| New Jersey | 220 | 7 | 29.9 | 22% | 40% |
| Arkansas | 1,551 | 193 | 29.8 | 28% | 24% |
| Virginia | 1,130 | 55 | 28.6 | 20% | 33% |
| Wisconsin | 1,532 | 162 | 28.3 | 11% | 32% |
| Ohio | 1,044 | 64 | 25.6 | 18% | 36% |
| New Hampshire | 225 | 4 | 25.1 | 12% | 34% |
| North Carolina | 1,214 | 59 | 25.0 | 20% | 29% |
| Kentucky | 985 | 82 | 24.9 | 18% | 29% |
| Mississippi | 1,144 | 92 | 24.4 | 27% | 28% |
| Tennessee | 933 | 34 | 22.6 | 21% | 27% |
| South Carolina | 676 | 39 | 22.5 | 21% | 30% |
| Massachusetts | 169 | 5 | 21.7 | 17% | 36% |
| West Virginia | 497 | 37 | 20.7 | 31% | 35% |
| Louisiana | 890 | 74 | 20.6 | 27% | 30% |
| Pennsylvania | 890 | 48 | 19.9 | 15% | 30% |
| Alabama | 973 | 100 | 19.2 | 28% | 29% |
| Delaware | 34 | 3 | 17.4 | 15% | 29% |
| Wyoming | 1,545 | 156 | 15.9 | 9.6% | 21% |
| Georgia | 863 | 31 | 15.0 | 26% | 31% |
| New York | 586 | 33 | 12.4 | 18% | 33% |
| Florida | 648 | 36 | 12.1 | 27% | 31% |
| Michigan | 677 | 70 | 12.0 | 15% | 32% |
| Connecticut | 57 | 2 | 11.8 | 28% | 37% |
| Montana | 1,644 | 175 | 11.3 | 13% | 27% |
| Rhode Island | 10 | 0 | 9.7 | 30% | 30% |
| New Mexico | 1,158 | 133 | 9.5 | 20% | 22% |
| Vermont | 81 | 0 | 8.8 | Too few | Too few |
| Maine | 232 | 6 | 7.5 | 14% | 32% |
| Idaho | 224 | 8 | 2.7 | 25% | 29% |
| Arizona | 252 | 8 | 2.2 | 26% | 29% |
| Oregon | 142 | 9 | 1.5 | 23% | 28% |
| Utah | 76 | 1 | 0.9 | 20% | 24% |
| Washington | 62 | 3 | 0.9 | 25% | 30% |
| California | 105 | 3 | 0.7 | 19% | 28% |
| Nevada | 49 | 1 | 0.4 | 31% | 34% |
| Hawaii | 1 | 0 | 0.2 | 22% | 39% |
| Alaska | 3 | 0 | 0.0 | 5.3% | 20% |
Storage shares are for facilities in our directory, states with at least 20 facilities. DC: 17 hail reports, 12 facilities; not shown. Download this table (CSV)
Where hail is common, a roof over the rig earns its cost fastest. Covered storage is most common in Texas (30.2% of facilities mention it), Oklahoma (21.7%) and Kansas (22.0%). Further north the hail belt leans on indoor storage instead: in Nebraska only 9.7% of facilities mention covered spaces but 34.9% mention indoor ones, and in South Dakota it is 7.8% against 31.1%. See the full supply picture in our RV storage supply map.
Insurance basics for hail
Hail damage to an RV is normally paid under the other-than-collision (comp) coverage on your RV policy, the same part that covers theft, fire, falling objects and animal damage. Liability-only policies do not pay for hail. Some points to check with your agent:
- Keep comp coverage in storage. Many insurers offer a storage or lay-up option that drops liability and collision while the rig is parked. Keep the other-than-collision part, because that is the part that covers hail, theft and rodents.
- Know your deductible. Ask whether hail falls under your regular comp deductible or a separate wind and hail deductible, and whether it is a flat amount or a percentage of the RV's value.
- Ask how roofs are settled. Some policies pay the depreciated value of an older roof rather than replacement cost. Know which one you have before a storm.
- Document the roof now. Dated photos of the roof, vents, skylights and caps make a claim far easier to prove.
- Read the storage contract. Storage facilities generally do not insure your RV against weather, covered spaces included.
What it means for you
- In Hail Alley, pay for a roof. Covered RV storage stops most direct hits on the roof and caps; indoor RV storage protects the sides as well.
- Check how the cover is built. Ask whether a canopy is rated for hail and wind, and whether the sides are open. Wind-driven hail can still reach the front and sides under an open carport.
- Plan for April to July. If you keep the rig at home between trips, consider a covered spot for the spring months, or a hail-rated cover you can fit fast.
- Inspect after every storm. Hail can split a vent cover or crack sealant without obvious marks. Small cracks become leaks. Check the winterize-by calendar and The RV Owner's Year for the rest of the seasonal checklist.
- Compare rates. Covered and indoor spaces cost more than an open lot; our RV Storage Rate Index shows the typical difference.
The infographic
Free to use with a link. Publish the graphic or the numbers anywhere, as long as you credit RV Storage Rates with a link to this page.
How we did this
- We used the NOAA Storm Prediction Center's severe weather database of hail reports and kept the 69,967 reports of hail 1 inch or larger from 2014 to 2023 (7,781 of them 2 inches or larger).
- State density = reports in the state over the ten years, divided by its land area from the US Census Bureau county gazetteer, expressed per 10,000 square miles per year. DC is left out of the map because its small area inflates the rate.
- Monthly counts are national totals of the same reports by the month they occurred.
- Covered and indoor shares are the share of storage facilities in our directory, October 2026, whose description or Google reviews mention covered spaces (covered, canopy, carport, roofed) or indoor spaces (indoor, enclosed, warehouse, RV garage). States with fewer than 20 facilities are left out.
- Storm reports undercount sparsely populated areas. The insurance section is general information, not advice on any policy.
Sources
- NOAA Storm Prediction Center, Severe Weather Database files (hail, 1955-2023), accessed October 25, 2026
- US Census Bureau, Gazetteer Files (county land area), accessed October 25, 2026
- RV Storage Rates directory listings (Google Business Profile data via DataForSEO), accessed October 20, 2026
- RV Storage Rates analysis, October 2026
Cite this: RV Storage Rates, "Hail Alley and your RV roof: Kansas logs 77 big-hail reports per 10,000 square miles a year, California under 1," October 25, 2026, https://rvstoragerates.com/rv-hail-risk-by-state/
Spotted an error or have newer data? Tell us and we'll check it and update the page.
Questions people ask
Which states get the most hail?
By density, Kansas leads with 77.4 reports of 1-inch-plus hail per 10,000 square miles a year (2014-2023), followed by Nebraska (68.0), Oklahoma (55.9), South Dakota (50.4) and Iowa (50.3). Texas has the most reports in total: 10,124 of 1-inch-plus hail in ten years.
When is hail season?
April to July. 74.4% of the 69,967 large-hail reports in 2014-2023 fell in those four months, with the peak in May (16,125 reports). December and January had fewer than 400 each.
Does RV insurance cover hail damage?
Usually, if you carry other-than-collision (comp) coverage, which pays for hail, theft, fire and animal damage. Liability-only policies don't. If you switch to a storage or lay-up policy, keep the comp part. Check your deductible and whether roofs are paid at replacement or depreciated value.
Is covered RV storage worth it?
It matters most where hail and sun are worst. In Kansas, Nebraska, Oklahoma and Texas, large hail is reported dozens of times per 10,000 square miles every year, mostly in spring when rigs are in use. A covered or indoor space protects the roof, which is the costliest part to repair after hail.