RV storage supply map: Montana has 21.5 storage facilities per 100,000 residents, New York 2.8
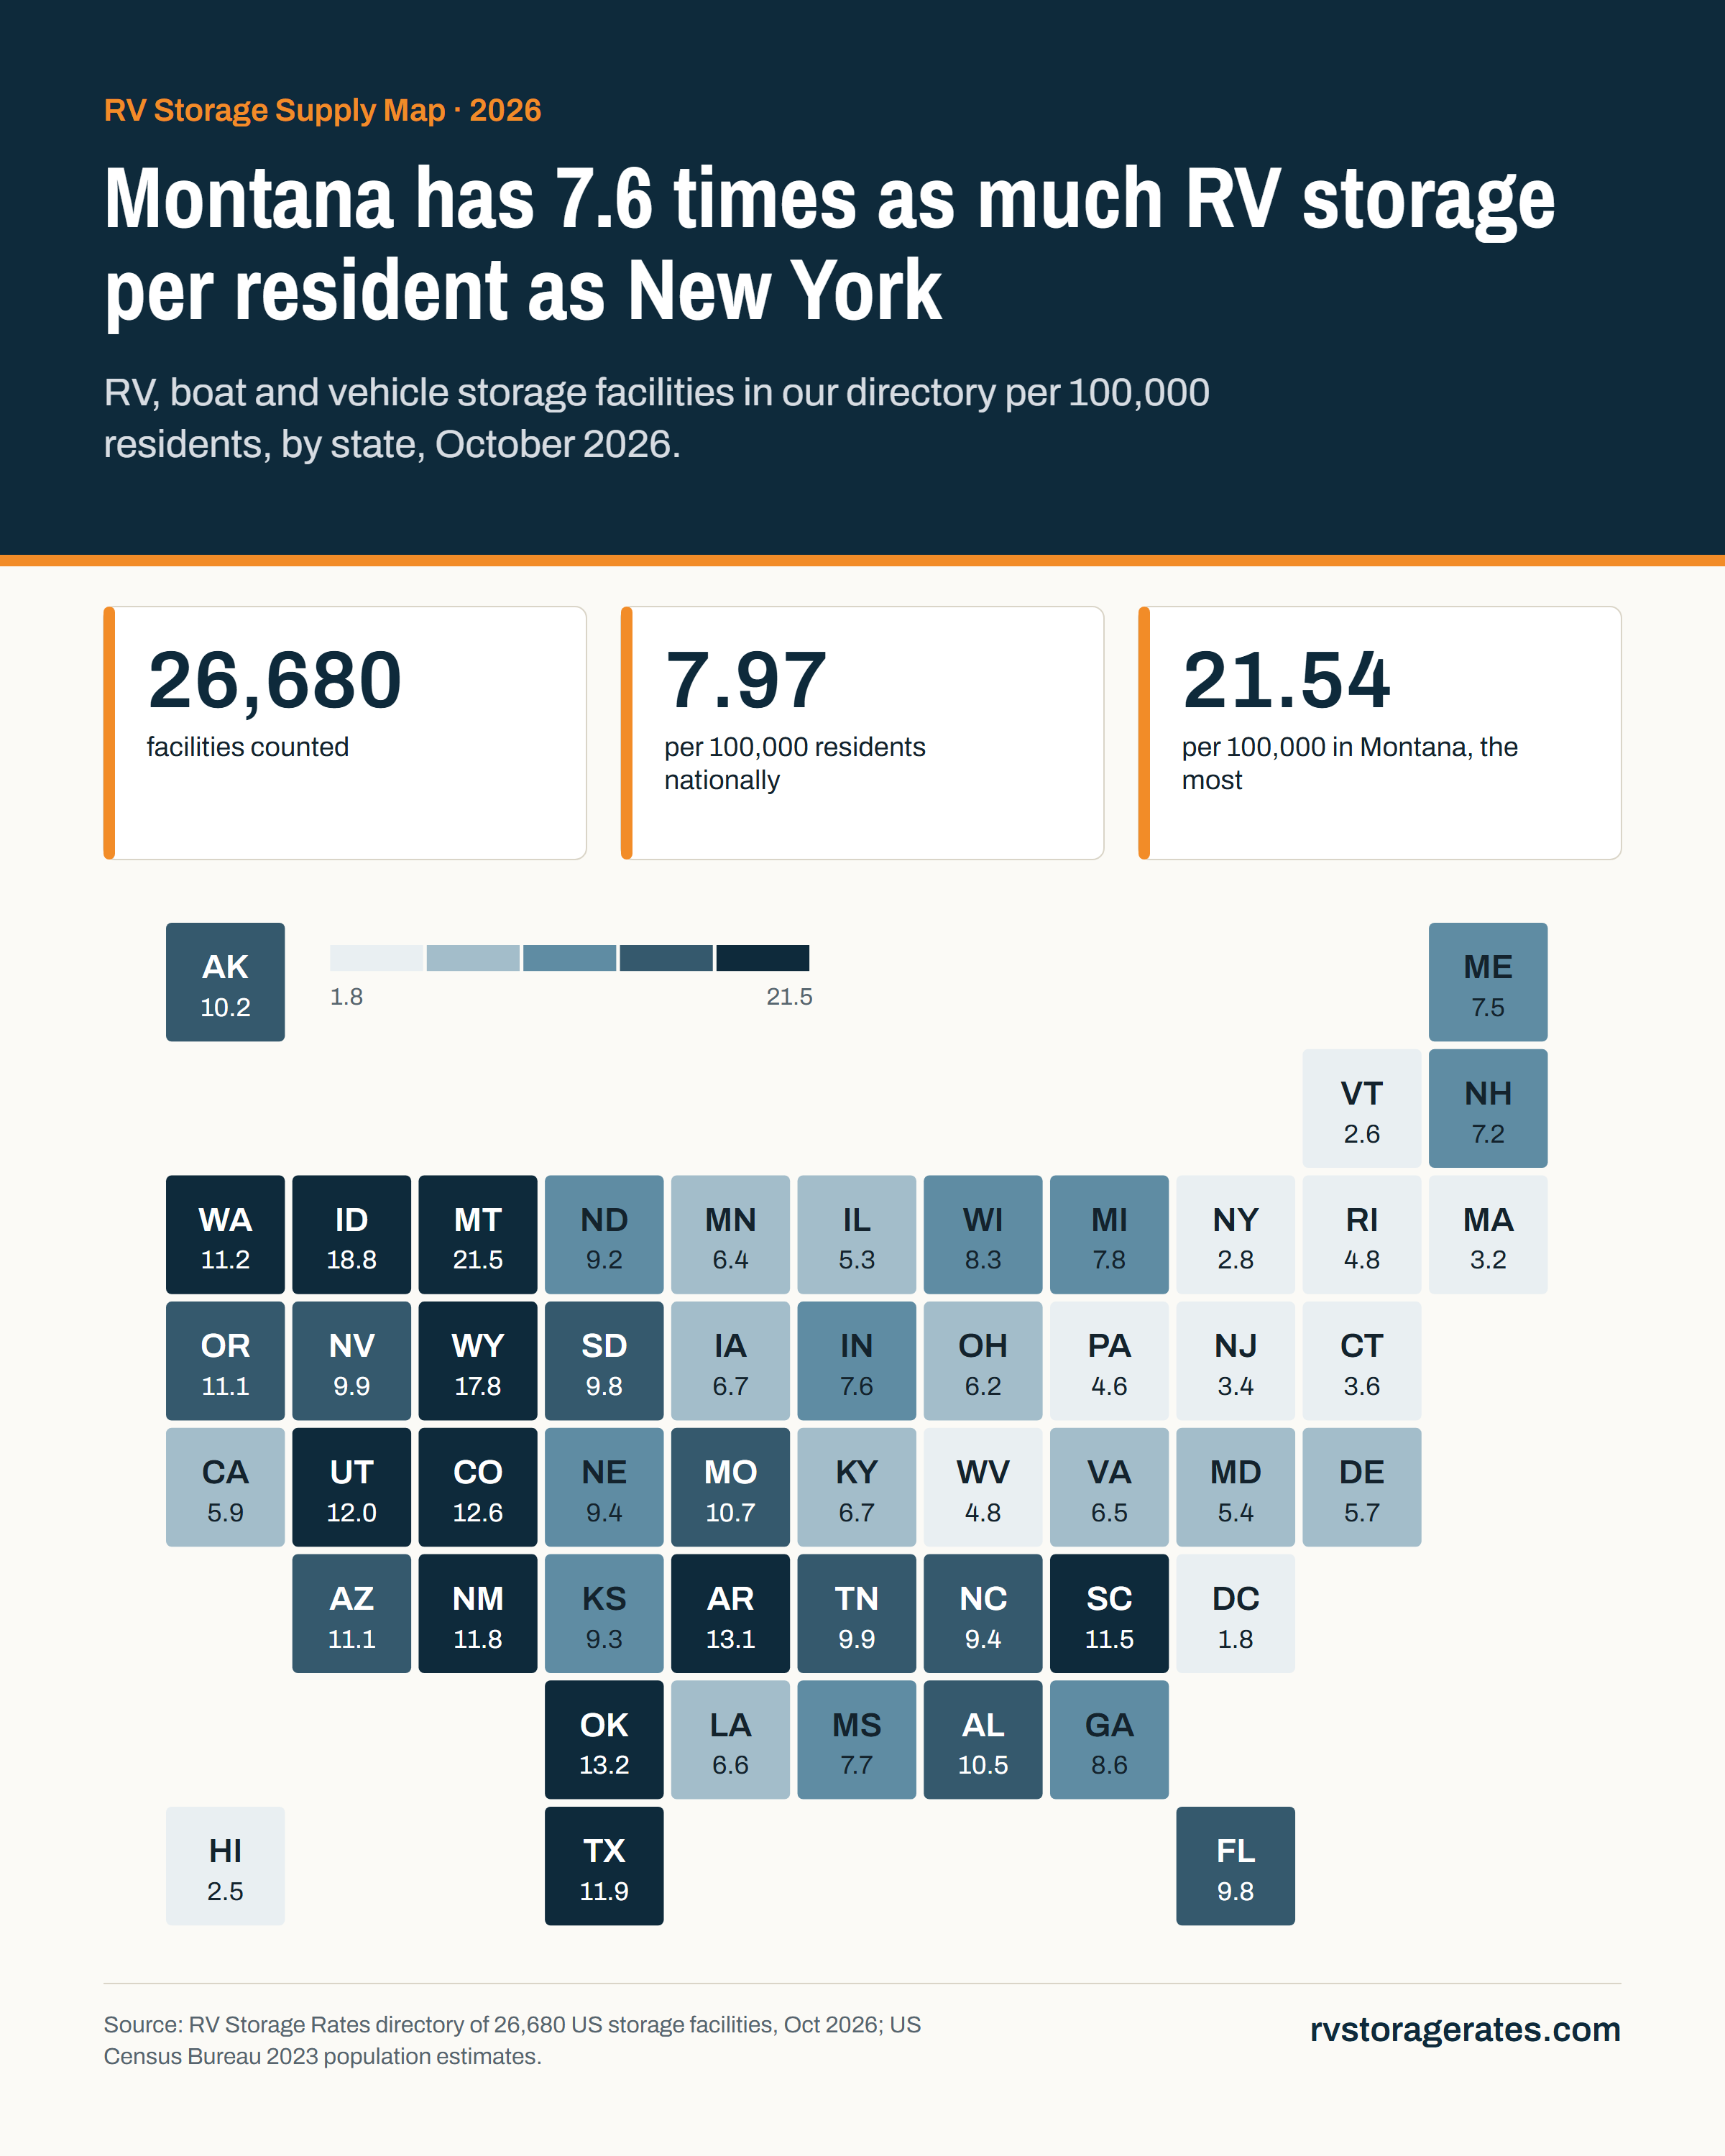
We counted the 26,680 RV, boat and vehicle storage facilities in our directory by state and divided by population. The national figure is 7.97 per 100,000 residents. Montana leads at 21.54, followed by Idaho and Wyoming; New York, Vermont, Hawaii and DC have fewer than 3.
By the RV Storage Rates research desk · Published October 25, 2026
Key findings
- 7.97 facilities per 100,000 residents nationally, across 26,680 storage facilities in our directory.
- The Mountain West has the most per person: Montana 21.54, Idaho 18.78 and Wyoming 17.81 per 100,000.
- The Northeast has the least: New York 2.83, Massachusetts 3.21, New Jersey 3.43 and Connecticut 3.65, with Vermont 2.63, Hawaii 2.51 and DC 1.77.
- Texas has the most facilities (3,643) at 11.94 per 100,000. California has 2,283 but only 5.86 per 100,000.
- About 22.1% of facilities mention covered storage and 31.0% indoor or enclosed storage. Covered mentions run highest in West Virginia (31.0%), Nevada (30.7%) and Texas and Rhode Island (30.2%).
Storage facilities per 100,000 residents
Supply per person is highest where land is cheap, populations are small and RV ownership is common. The Mountain West, the southern Plains and Texas all sit well above the national 7.97. Dense, expensive states in the Northeast and on the West Coast sit lowest, where land near cities is costly and big outdoor lots are scarce.
Per-person supply is not the same as availability. Texas has more facilities than any other state, 3,643, and a healthy 11.94 per 100,000. California has the second-largest count, 2,283, but only 5.86 per 100,000, about one facility for every 17,000 residents. In the states at the bottom of the list, expect to drive farther or pay more. You can check what is near you from the state pages.
Covered and indoor storage by state
We also checked how many facilities mention covered storage (canopies, carports, roofed spaces) or indoor storage (enclosed units, warehouses, RV garages) in their own description or their reviews. Nationally 22.1% mention covered spaces and 31.0% mention indoor or enclosed storage. Many facilities offer more than one kind.
Covered storage is most common in hot, sunny and hail-prone states: West Virginia (31.0%), Nevada (30.7%), Texas and Rhode Island (30.2%). It is rarest in the northern Plains and Alaska, where Alaska (5.3%) and North Dakota (5.6%) lean on indoor storage instead: North Dakota has the highest indoor share at 48.6%, ahead of Minnesota (44.0%) and Illinois (43.1%). A roof over a parked RV matters most where sun and hail are the threat; see our hail risk map.
| Montana | 244 | 21.5 | 13% | 27% |
| Idaho | 369 | 18.8 | 25% | 29% |
| Wyoming | 104 | 17.8 | 9.6% | 21% |
| Oklahoma | 535 | 13.2 | 22% | 33% |
| Arkansas | 401 | 13.1 | 28% | 24% |
| Colorado | 742 | 12.6 | 16% | 30% |
| Utah | 409 | 12.0 | 20% | 24% |
| Texas | 3,643 | 11.9 | 30% | 31% |
| New Mexico | 249 | 11.8 | 20% | 22% |
| South Carolina | 616 | 11.5 | 21% | 30% |
| Washington | 871 | 11.2 | 25% | 30% |
| Arizona | 826 | 11.1 | 26% | 29% |
| Oregon | 470 | 11.1 | 23% | 28% |
| Missouri | 663 | 10.7 | 19% | 32% |
| Alabama | 537 | 10.5 | 28% | 29% |
| Alaska | 75 | 10.2 | 5.3% | 20% |
| Tennessee | 707 | 9.9 | 21% | 27% |
| Nevada | 316 | 9.9 | 31% | 34% |
| Florida | 2,220 | 9.8 | 27% | 31% |
| South Dakota | 90 | 9.8 | 7.8% | 31% |
| North Carolina | 1,022 | 9.4 | 20% | 29% |
| Nebraska | 186 | 9.4 | 9.7% | 35% |
| Kansas | 273 | 9.3 | 22% | 34% |
| North Dakota | 72 | 9.2 | 5.6% | 49% |
| Georgia | 949 | 8.6 | 26% | 31% |
| Wisconsin | 492 | 8.3 | 11% | 32% |
| Michigan | 787 | 7.8 | 15% | 32% |
| Mississippi | 225 | 7.7 | 27% | 28% |
| Indiana | 523 | 7.6 | 16% | 34% |
| Maine | 105 | 7.5 | 14% | 32% |
| New Hampshire | 101 | 7.2 | 12% | 34% |
| Iowa | 216 | 6.7 | 8.3% | 26% |
| Kentucky | 304 | 6.7 | 18% | 29% |
| Louisiana | 303 | 6.6 | 27% | 30% |
| Virginia | 570 | 6.5 | 20% | 33% |
| Minnesota | 368 | 6.4 | 17% | 44% |
| Ohio | 735 | 6.2 | 18% | 36% |
| California | 2,283 | 5.9 | 19% | 28% |
| Delaware | 59 | 5.7 | 15% | 29% |
| Maryland | 333 | 5.4 | 22% | 34% |
| Illinois | 662 | 5.3 | 18% | 43% |
| Rhode Island | 53 | 4.8 | 30% | 30% |
| West Virginia | 84 | 4.8 | 31% | 35% |
| Pennsylvania | 593 | 4.6 | 15% | 30% |
| Connecticut | 132 | 3.6 | 28% | 37% |
| New Jersey | 319 | 3.4 | 22% | 40% |
| Massachusetts | 225 | 3.2 | 17% | 36% |
| New York | 554 | 2.8 | 18% | 33% |
| Vermont | 17 | 2.6 | Too few | Too few |
| Hawaii | 36 | 2.5 | 22% | 39% |
| District of Columbia | 12 | 1.8 | Too few | Too few |
Facilities in the RV Storage Rates directory, October 2026. Covered and indoor shares are for states with at least 20 facilities. Download this table (CSV)
What it means for you
- In low-supply states, start early. Where facilities are scarce per resident, spaces fill before winter. Begin looking in late summer; storage searches peak in December, according to The RV Owner's Year.
- Look beyond the city. In the Northeast and California, a facility outside the metro area may be the realistic option. Weigh the drive against the rate.
- Covered space may be scarce where you live. If fewer than one facility in five mentions covered storage in your state, call ahead and ask about waitlists for covered RV storage.
- Consider indoor in the northern tier. Indoor storage is the common choice in the upper Midwest; compare indoor RV storage and climate-controlled storage if snow load and freeze are the concern.
- Check prices against the market. Our RV Storage Rate Index shows posted monthly rates by type and length.
The infographic
Free to use with a link. Publish the graphic or the numbers anywhere, as long as you credit RV Storage Rates with a link to this page.
How we did this
- We counted the 26,680 approved storage facilities in the RV Storage Rates directory, compiled from Google Business Profile data via DataForSEO and checked in October 2026, by the state in their address.
- Per-100,000 figures divide each state's count by its resident population from the US Census Bureau's 2023 state estimates (334.9 million in all, including DC).
- Covered and indoor shares are the share of facilities whose own description or Google reviews match keyword patterns, such as covered, canopy, carport or roofed for covered, and indoor, enclosed, warehouse or RV garage for indoor. A match means the topic is mentioned, not that the facility has open spaces of that kind. States with fewer than 20 facilities are left out.
- Our directory does not include every storage site in the US, and facility size is not measured; each facility counts once.
Sources
- RV Storage Rates directory listings (Google Business Profile data via DataForSEO), accessed October 20, 2026
- US Census Bureau, State Population Totals (Vintage 2023 estimates), accessed October 25, 2026
- RV Storage Rates analysis, October 2026
Cite this: RV Storage Rates, "RV storage supply map: Montana has 21.5 storage facilities per 100,000 residents, New York 2.8," October 25, 2026, https://rvstoragerates.com/storage-supply-by-state/
Spotted an error or have newer data? Tell us and we'll check it and update the page.
Questions people ask
Which state has the most RV storage?
Texas has the most facilities in our directory, 3,643. Per resident, Montana leads with 21.54 facilities per 100,000 people, followed by Idaho (18.78) and Wyoming (17.81). The national figure is 7.97 per 100,000.
Why is RV storage hard to find in the Northeast?
Supply per person is lowest there: New York has 2.83 facilities per 100,000 residents, Massachusetts 3.21 and New Jersey 3.43. Land near cities is expensive, so large outdoor lots are scarce and owners often have to look farther out.
How common is covered RV storage?
About 22.1% of the facilities in our directory mention covered spaces such as canopies or carports, and 31.0% mention indoor or enclosed storage. Covered storage is most common in West Virginia, Nevada, Texas and Rhode Island, and least common in Alaska and North Dakota.
Does this map include every RV storage facility?
No. It counts the 26,680 facilities in our directory, which is built from Google business listings for RV, boat and vehicle storage. Some facilities are missing, and a small lot counts the same as a large one.